8. Quiet Day Spectral Analysis
The FOURSQ1 program computes the Fourier harmonic spectral components (see Figure 1.12)
of quiet field records (see Figure 2.23 and 2.24) along with a determination of the daily
mean level and trend (slope). One can select the number of desired harmonics, up to
twenty-four. A special iterative technique of W.H. Campbell is employed to extract the
linear trend, embedded in the daily harmonics, to avoid improper trend contributions from
sine wave harmonics. An input of field value data at evenly spaced intervals (with a point
at the beginning and at the end) is required and a test is used to determine whether the
number of points is sufficient for the highest selected harmonic. The output is to the
computer screen and to a user-selected file. To start the program, place the disk in the
drive bay, set the computer for that drive, and enter FOURSQ1. Answer the questions at the
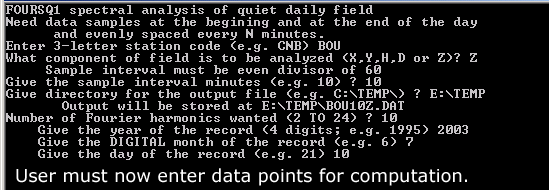
prompt. The daily quiet-time Sq field variations are analyzed using this program. An
example screen is shown below.

Download this program
Use your browser back button or the navigation bar at the top to return to the Geomagnetic Utility Programs Home.
|

